Starting from the official dashboard (which can be found here), I decided to make my own version, removing some metrics that I felt are useless and adapting it to work with Grafana Agent, with multiple instances.
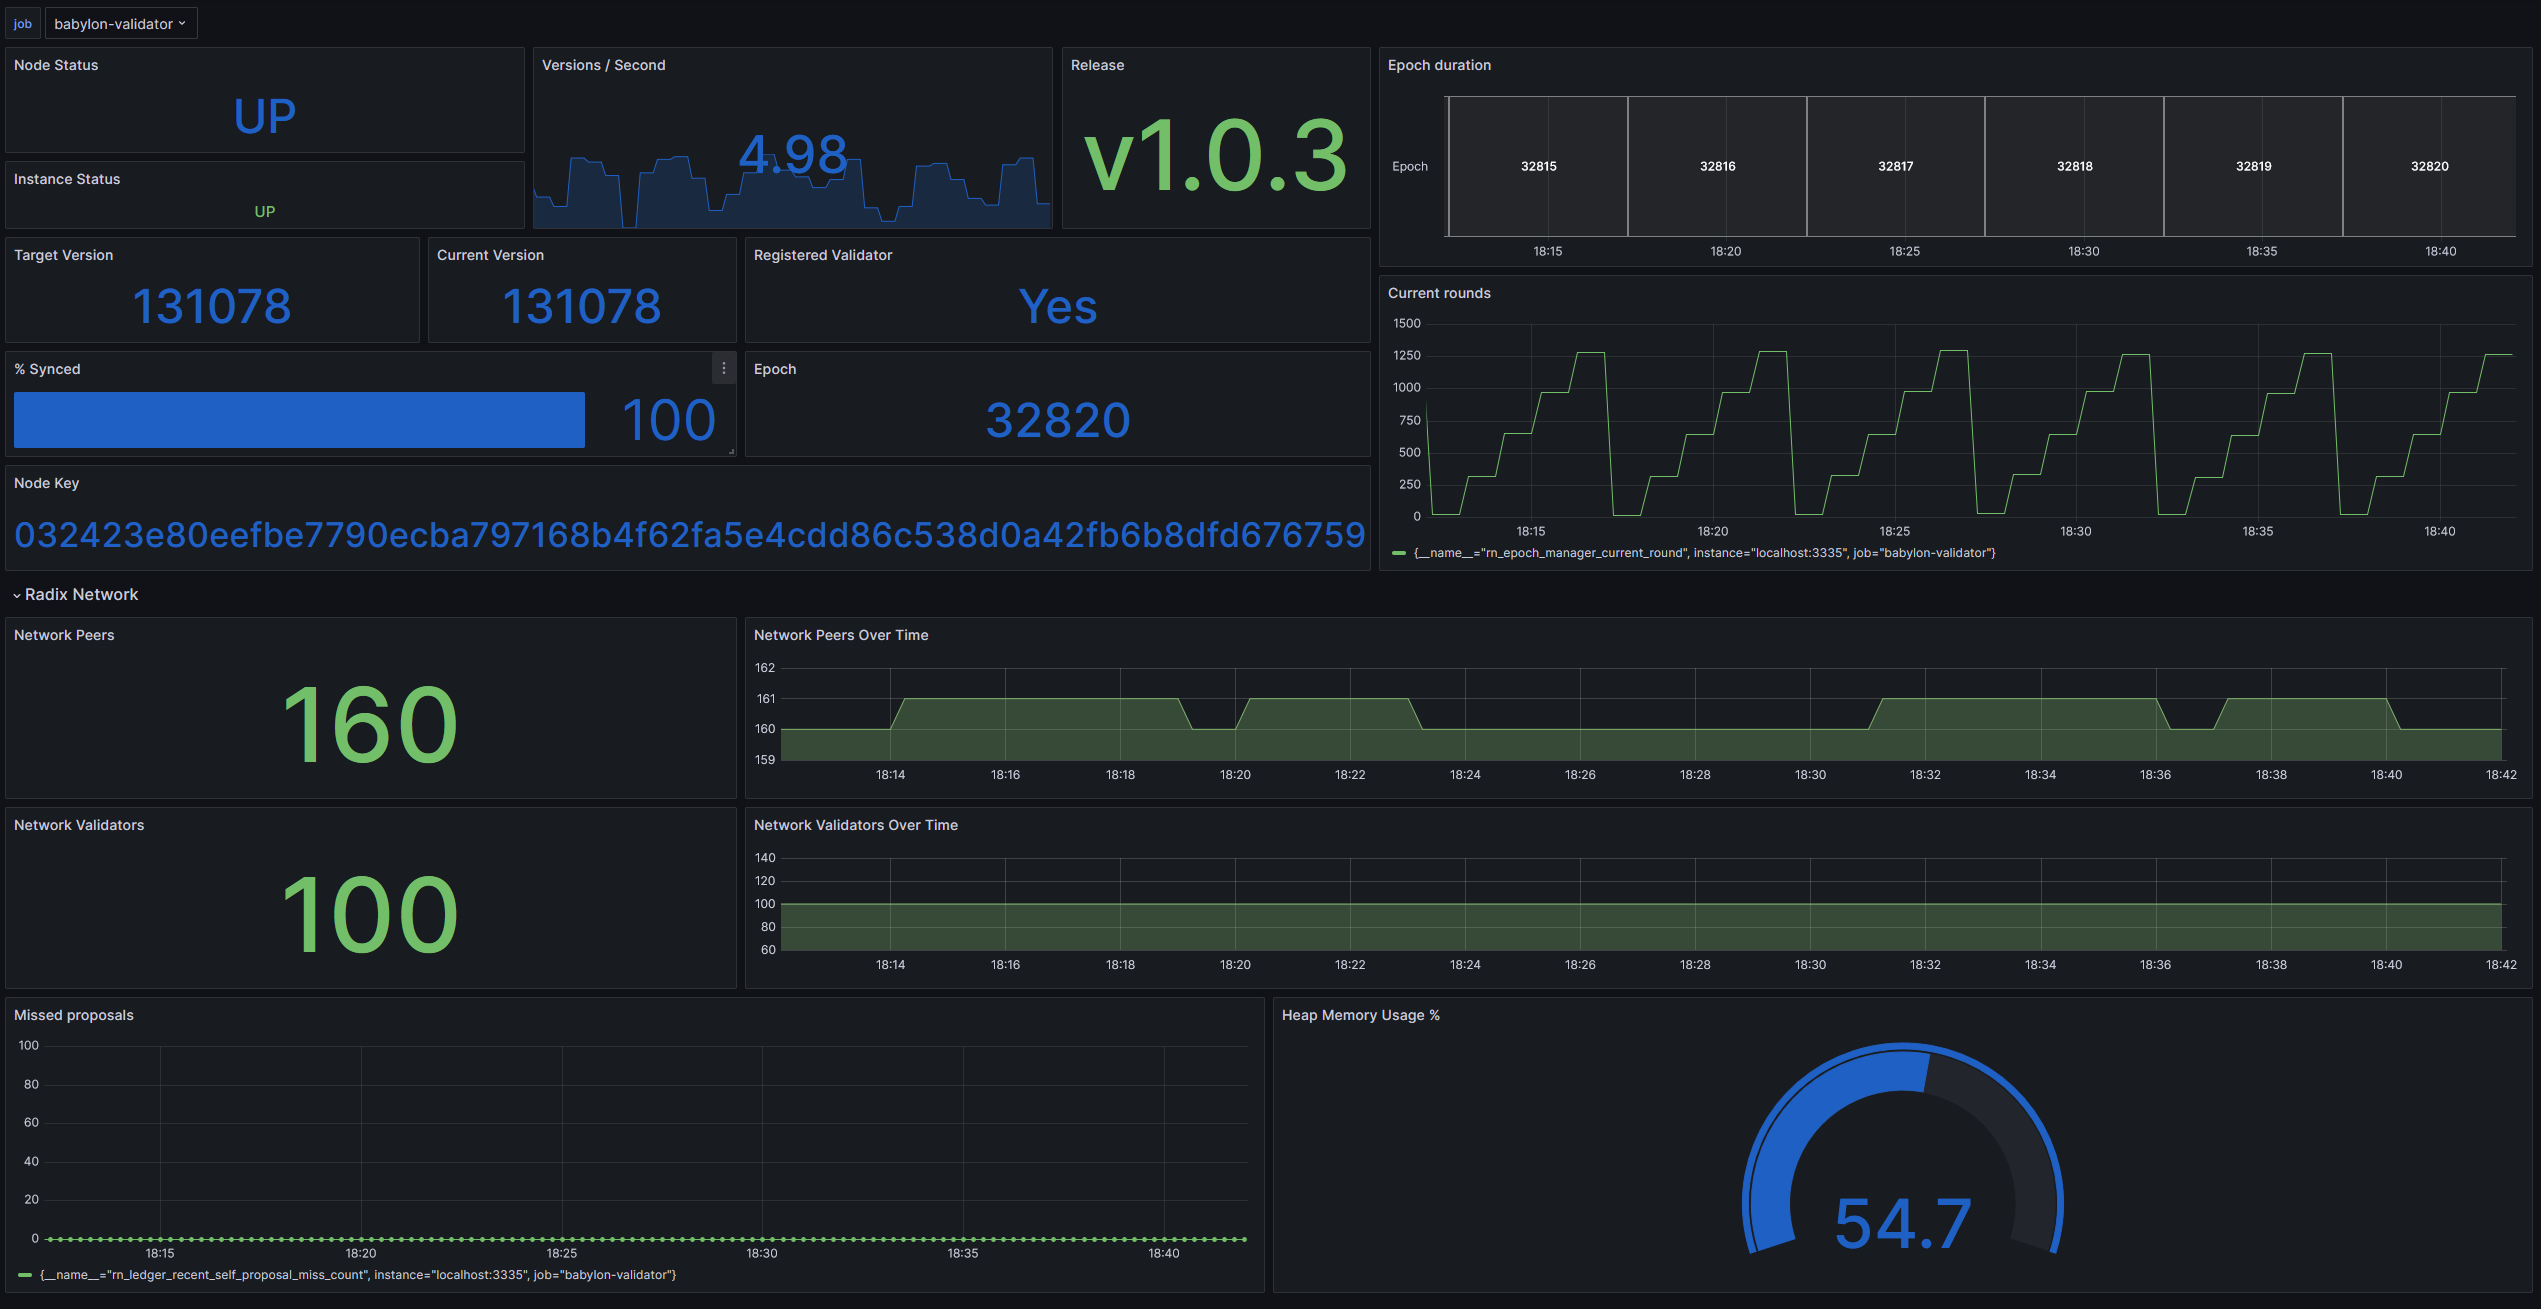
Dashboard link: Radix Babylon Grafana dashboard · GitHub
Installation is pretty straightforward:
- Install Grafana Agent (Connections → Add new connection → Linux Server)
- Edit /etc/grafana-agent.yaml:
Replace the whole metrics block with:
prometheus:
  configs:
  - name: integrations
    remote_write:
    - basic_auth:
        password: xx
        username: xx
      url: https://prometheus-blocks-prod-us-central1.grafana.net/api/prom/push
    scrape_configs:
      - job_name: babylon-validator
        static_configs:
          - targets: ['localhost:3335']
        metrics_path: /prometheus/metrics
Insert your password and username taken from the metrics block you just replaced. If you want to monitor multiple nodes, change job_name to something unique. For example, I use:
babylon-validatorfor main nodebabylon-backupfor backup nodebabylon-stokenetfor stokenet node
- Import the .json on Grafana Cloud
- You may have to update the name of your Prometheus data source: open the dashboard, click the cogwheel on the right to open the settings, go to “variables” and edit “prometheus” with your data source name. If you’re using Grafana Cloud it’s usually grafanacloud-username-prom, with username being your subdomain for grafana.net
- If you changed the metrics port, also update the variable “instance” with the correct port.
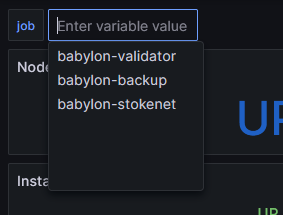
- Also update the “job” variable with all the job_name you have used for all your different nodes, comma separated.
This allows you to easily choose which node you want to monitor:
My dashboard might still be missing something, so please feel free to share your thoughts or any metrics that might be useful to monitor. If you want to share your dashboard as well, go ahead!
Thanks to @Faraz for helping with the Epoch Duration panel.