When it comes to adding metrics into Grafana, Radix have provided the metrics end point which provides a certain amount of data from the node in Prometheus format which can then be visualised by Grafana.
However, there may be other metrics that node runners desire that are not currently present in the core API, but may be present in the Gateway. This post explains how to import REST API data directly into Grafana. For this example we will use Validator Total Stake (this is currently not available in the Core API, but can be requested through the Gateway).
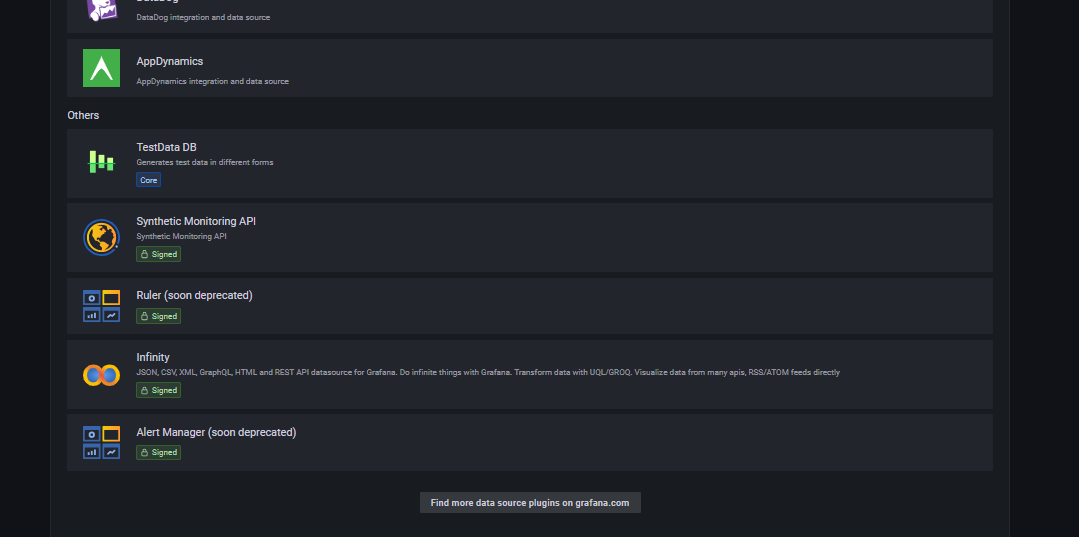
- Find the Infinity data source by selecting configuration–>data sources–>add data source–>find more data source plugins on grafana
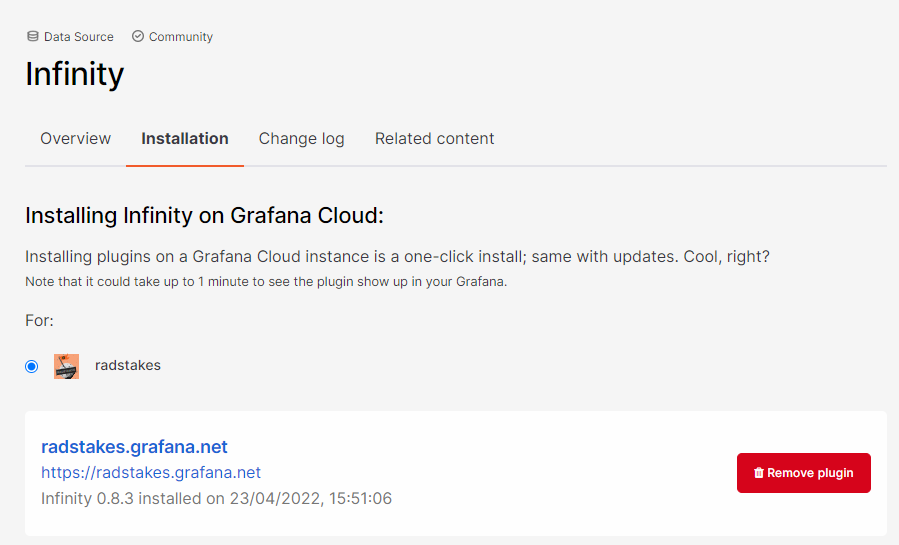
- add the plugin to Grafana cloud (there are also instructions if you are using Grafana locally)
- add the data source by selecting it from the list in Grafana cloud
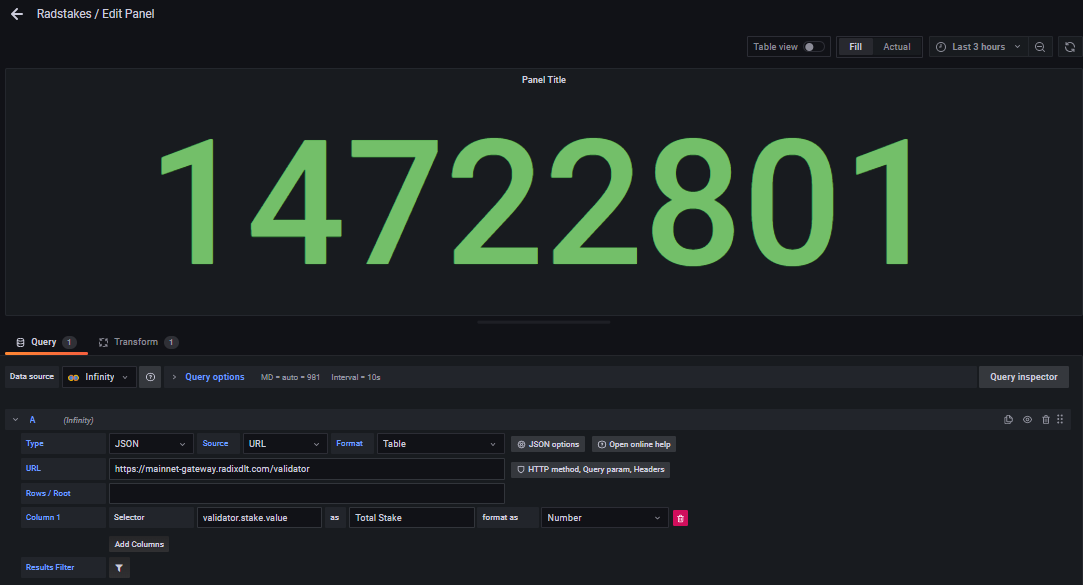
- add a new panel using the “Stat” visualisation and the fields below:
- in the HTTP method, query param, headers option - enter POST as the method along with the following body:
{
  "network_identifier": {
    "network": "mainnet"
  },
  "validator_identifier": {
    "address": "rv1qdzgjh98d4mexymc492eq82zwmspmh9mlz4wqgswta4jcaw0nnwuj53mj5w"
  },
  "at_state_identifier": {
    "epoch": "0"
  }
}
- Make sure the header “content-type = application/json” is also included in the header tab.
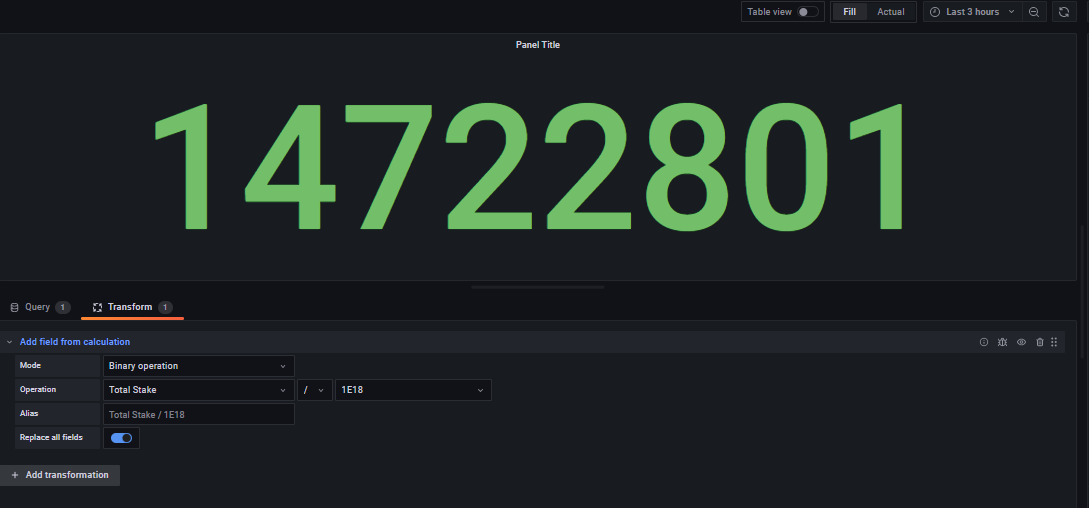
- Using the transform field, reduce the field to a more human number by dividing by 1E18 and select ‘replace all fields’
- In the panel options, select 0 for decimals
- You now have validator total stake displayed on your dashboard!