Love it.
I will think about what else.
Initial reaction is that this chart seems self-contained, but other charts may be needed for other metrics.
Will think about it.
Looks very nice!
I would also add more metrics, but I’m not sure how everything could fit in one image though…
For example:
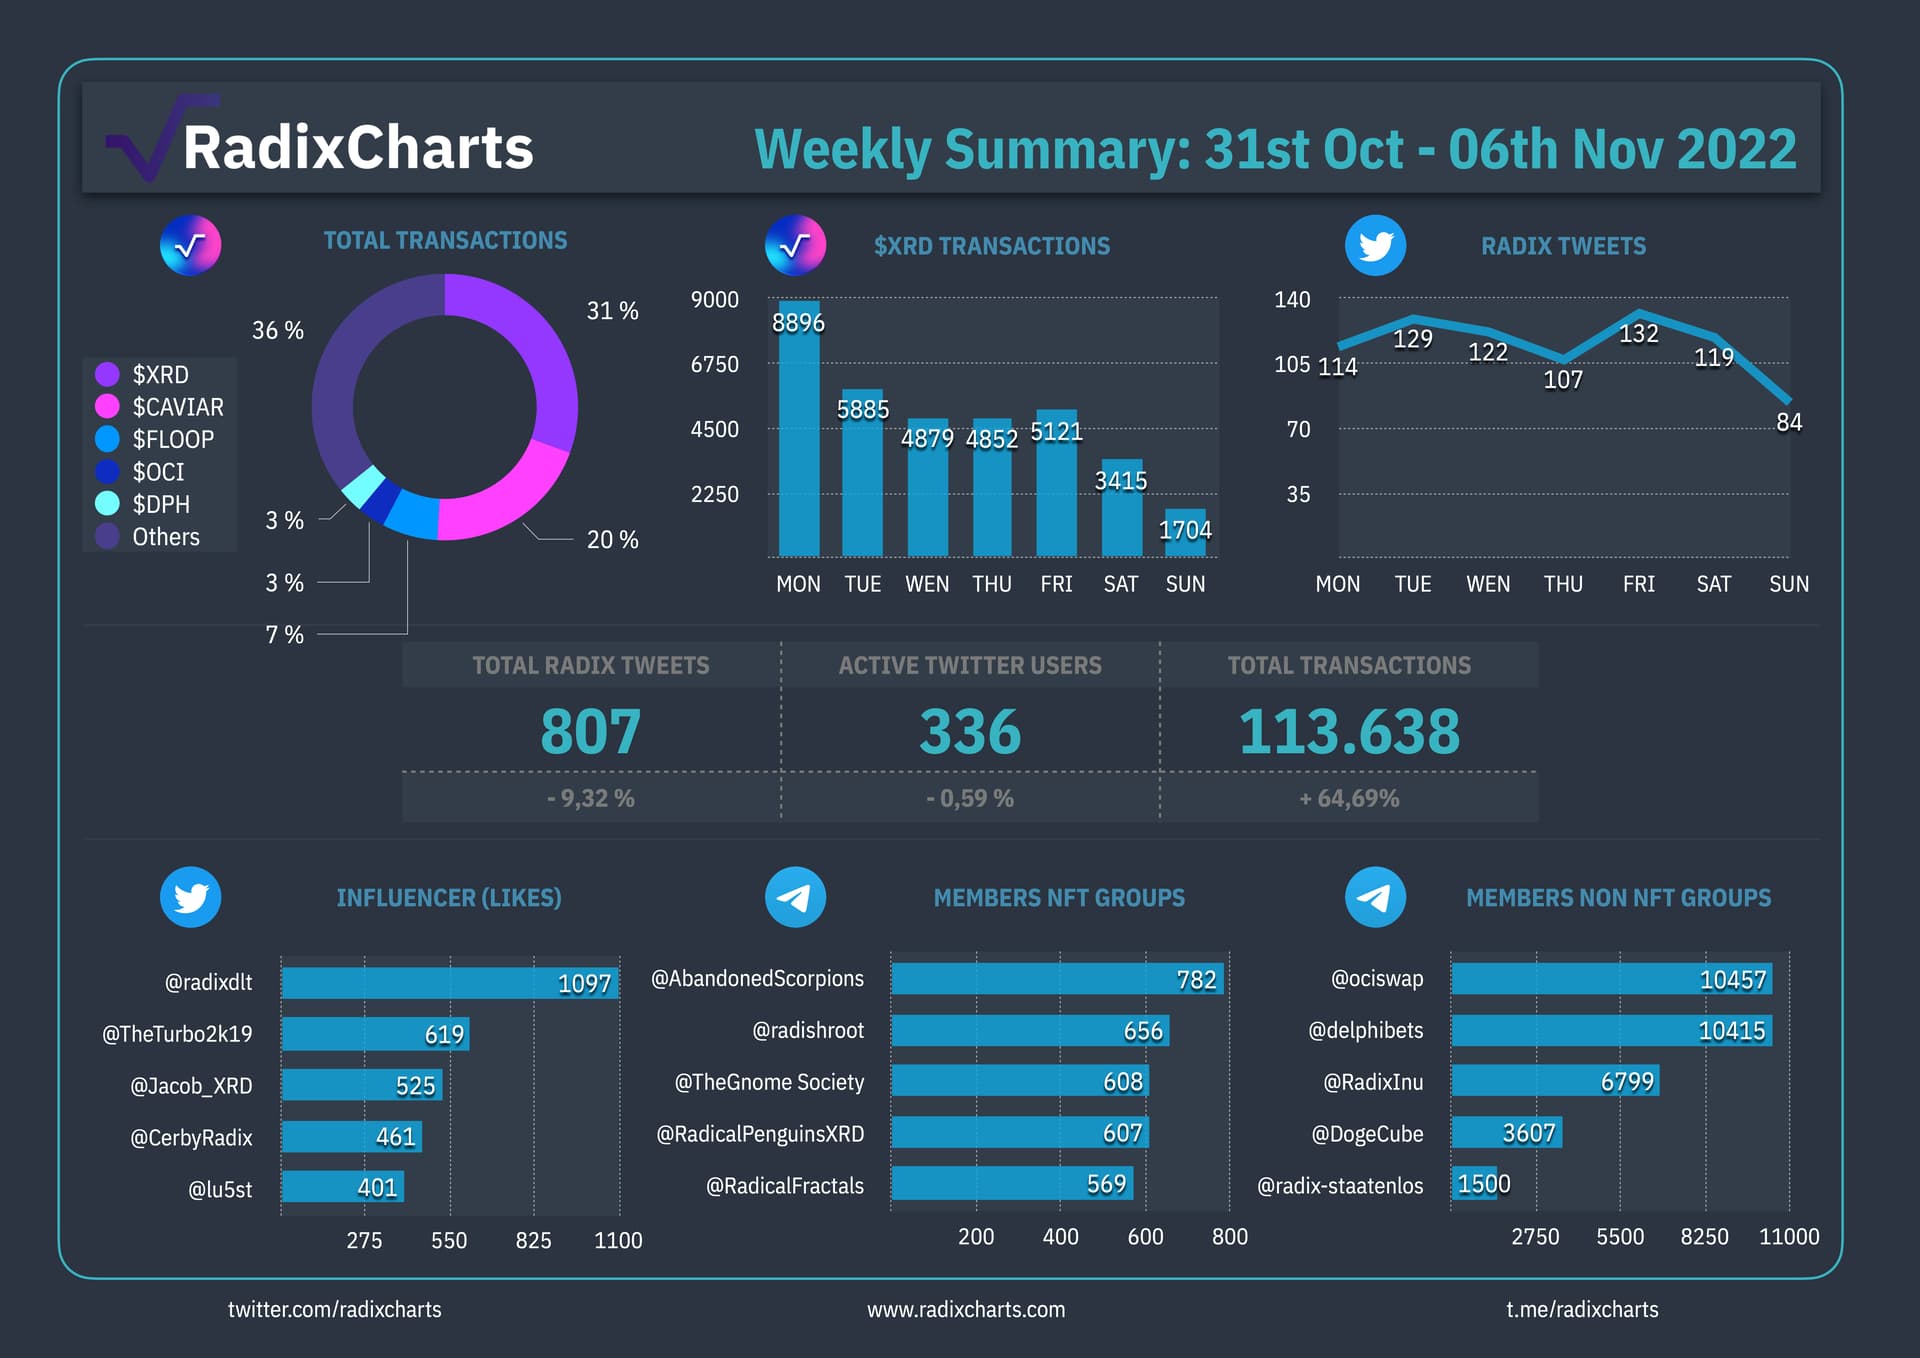
Trends: Ociswap and Delphibets are probably going to remain in the top 2 in members non NFT groups for a long time. Instead, showing which groups gained the most users or most messages in a week might be more useful.
I would remove the Radix Team tweets (radixdlt, Jacob_XRD, etc…) from influencer (likes).
Instead of showing $XRD transactions per weekday (which might remain the same for each week, Monday will probably always be the one with most transactions), show how many transactions we had this week compared to the last week, like you already do for the number of total transactions.
Also would be cool to know what that 36% of Other transactions are made of! That’s a lot.
Thank you Nelly!
Point 1: yes, I agree that would be more interesting information.
Point 2: not sure about that, I would need a black list to filter them out for the automatic dashboard on the website but I don’t really want to limit the data. Will think about it.
Point 3: I could probably do a combined chart and showing both in comparison. The idea is to show when there is a real peak.
There is a list of ALL transactions with a rating available on https://radixcharts.com/Token I think there is no way to show them all in one pie chart.