The official Radix docs for installing the node software includes instructions for setting up Grafana locally to visualise the Prometheus metrics: Installing Grafana Dashboard
The panel which shows “Registered Validator” reads a metric from the node info called validator_registered. Unfortunately this metric no longer exists in v1.1.0 so if you are setting up a Grafana dashboard after upgrading to this node version, the panel will incorrectly state “No” even if your node is correctly registered.
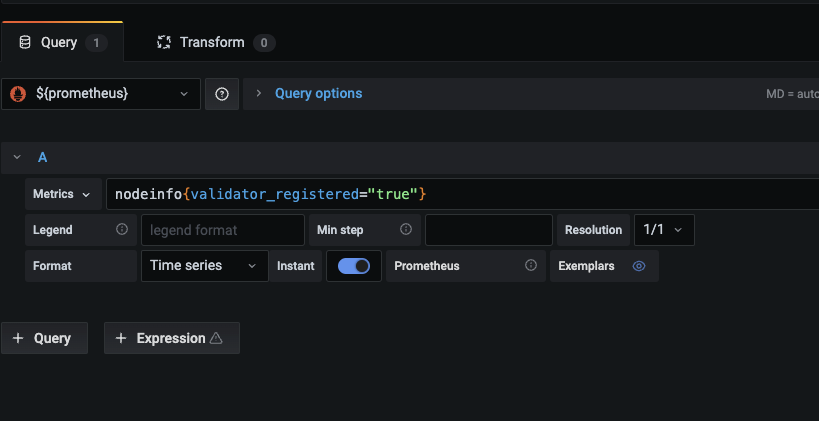
The Radix team have acknowledged this and will be updating the Grafana dashboard in a future update. In the meantime, you can edit the panel and change the metric to nodeinfo{is_in_validator_set=“true”}